
Where is it going?
Separate whole-building demand into the systems and assets that create it.
Energy management for complex facilities
Real-time monitoring, analytics and controls that help commercial and industrial facilities find waste, reduce operating costs and verify results.
The information gap
A monthly total cannot show which chiller created the peak, why compressed air stayed high overnight or whether an HVAC change actually worked.
Seek Energy builds the missing operational view - then helps your team use it to prioritize decisions.
Separate whole-building demand into the systems and assets that create it.
Find runtime, peaks and abnormal behaviour that bills and averages hide.
Rank actions using measured impact, operational risk, cost and confidence.
Compare results to a defensible baseline and watch for performance drift.
One connected service
The technology stack is selected around the facility and the decision - not the other way around.
Energy Monitoring & EMIS
Bring utility, building and asset data into one continuously available view so facility teams can see patterns, exceptions and results.
Explore this solutionSub-Metering & Asset-Level Visibility
Measure the systems that matter - not every circuit - to isolate waste, compare assets and build credible business cases for action.
Explore this solutionEnergy Audits & Optimization
Combine bills, interval data, site observations and operating knowledge to identify what is happening, why it is happening and what should be fixed first.
Explore this solutionSmart Controls & IoT
Use schedules, environmental sensing, alerts and site-appropriate control strategies to reduce avoidable runtime without compromising operations.
Explore this solutionOngoing Energy Management
Review performance, investigate exceptions and maintain an active pipeline of improvements instead of letting energy drift return unnoticed.
Explore this solutionHow it works
Visibility has value only when it changes a decision. The process keeps every data point tied to a question, an owner and a next action.
See the full implementation processReview bills and facility context, then capture focused data from the buildings and assets that can change a decision.
Connect load profiles, equipment behaviour, schedules and operating context to explain what is happening and why.
Rank operational, maintenance, controls and capital actions by value, confidence, effort and operational risk.
Implement the selected changes with clear owners, timelines, control requirements and success criteria.
Compare results to the baseline, account for relevant drivers and watch for performance drift.
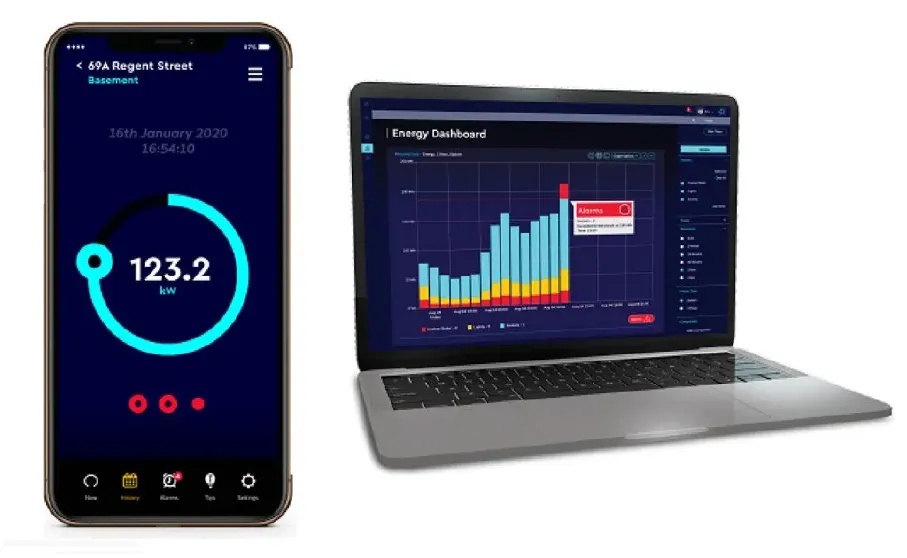
Operational visibility
Asset-level profiles, comparisons, alarms and operating context turn a monthly cost into information a facility team can act on.
Understand normal operation by site, asset and operating period.
Focus attention on meaningful changes instead of watching every data point.
Keep before-and-after evidence visible to operations and financial decision-makers.
What the data can uncover
The goal is not to find more charts. It is to isolate avoidable cost, diagnose its cause and define a practical response.
Trace overnight, weekend and seasonal base load to the systems creating it.
Connect demand events to specific equipment, sequences and operating decisions.
Compare similar equipment, sites, shifts or operating periods against a useful baseline.
Use energy and environmental context to spot conflicts, overrides and unnecessary runtime.
Create alerts and review exceptions before excess consumption becomes normal.
Compare performance before and after action using the most relevant operating drivers.
Built for energy-intensive operations
The strongest candidates have significant loads, long operating hours, multiple systems or sites, and limited visibility below the utility meter.
Explore all industries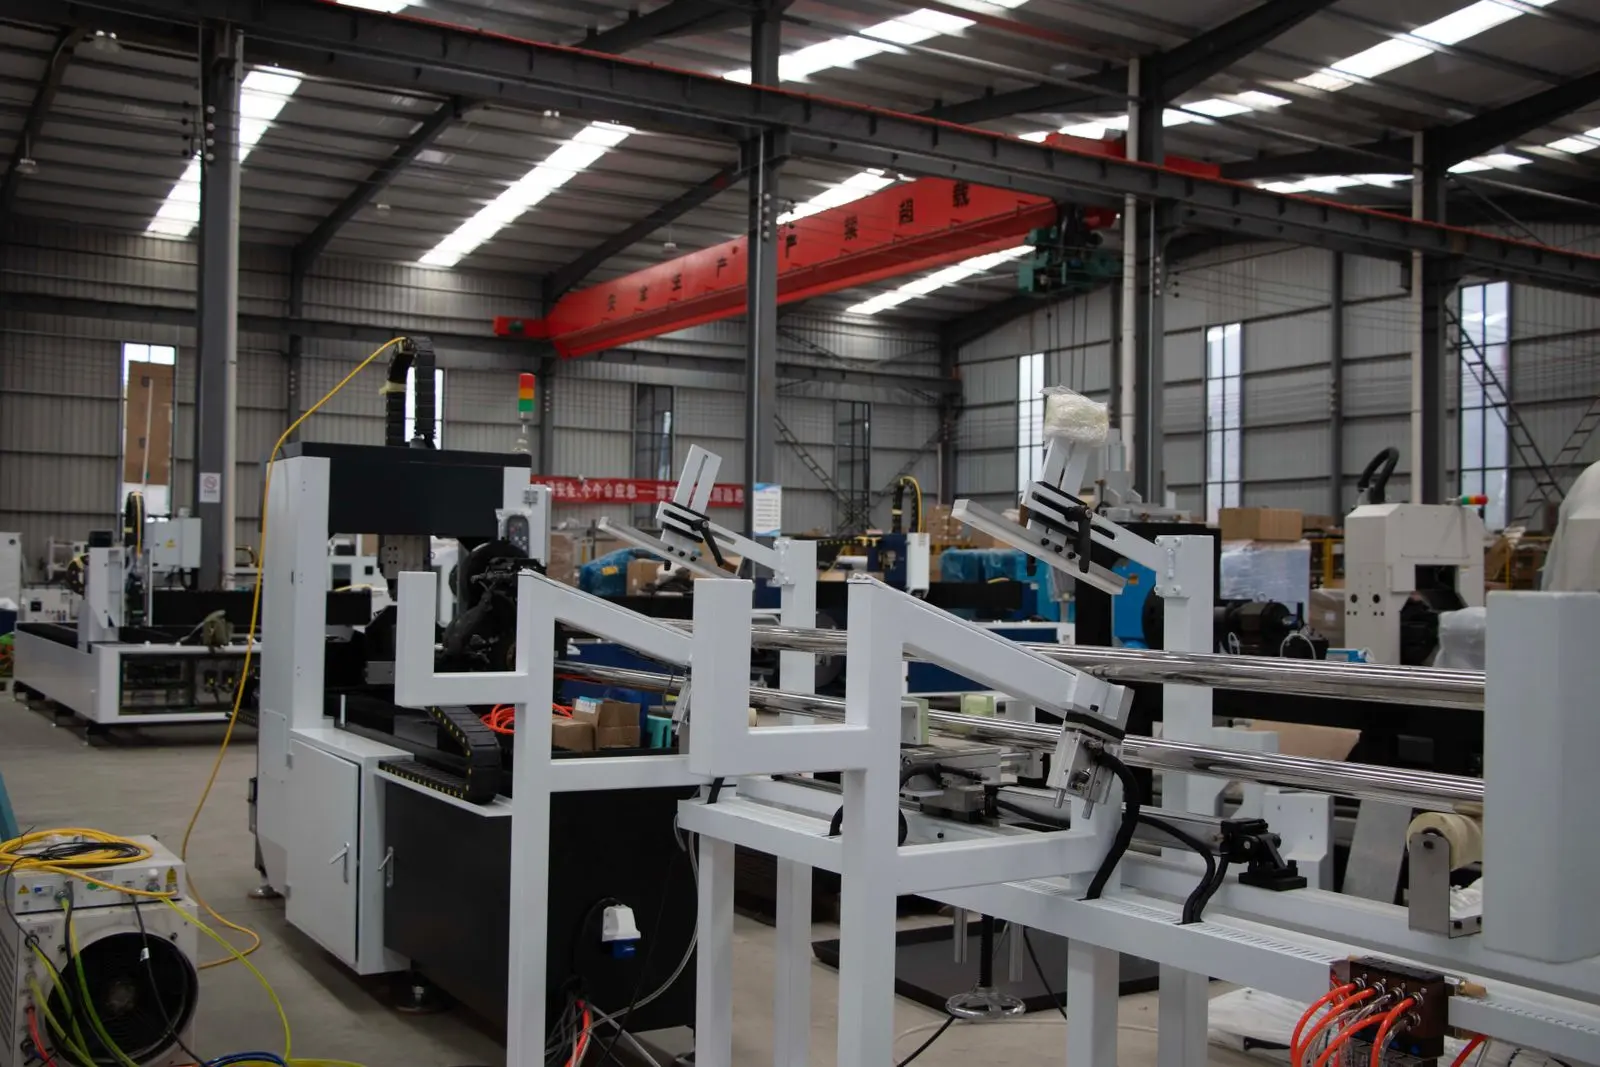
Case-study results
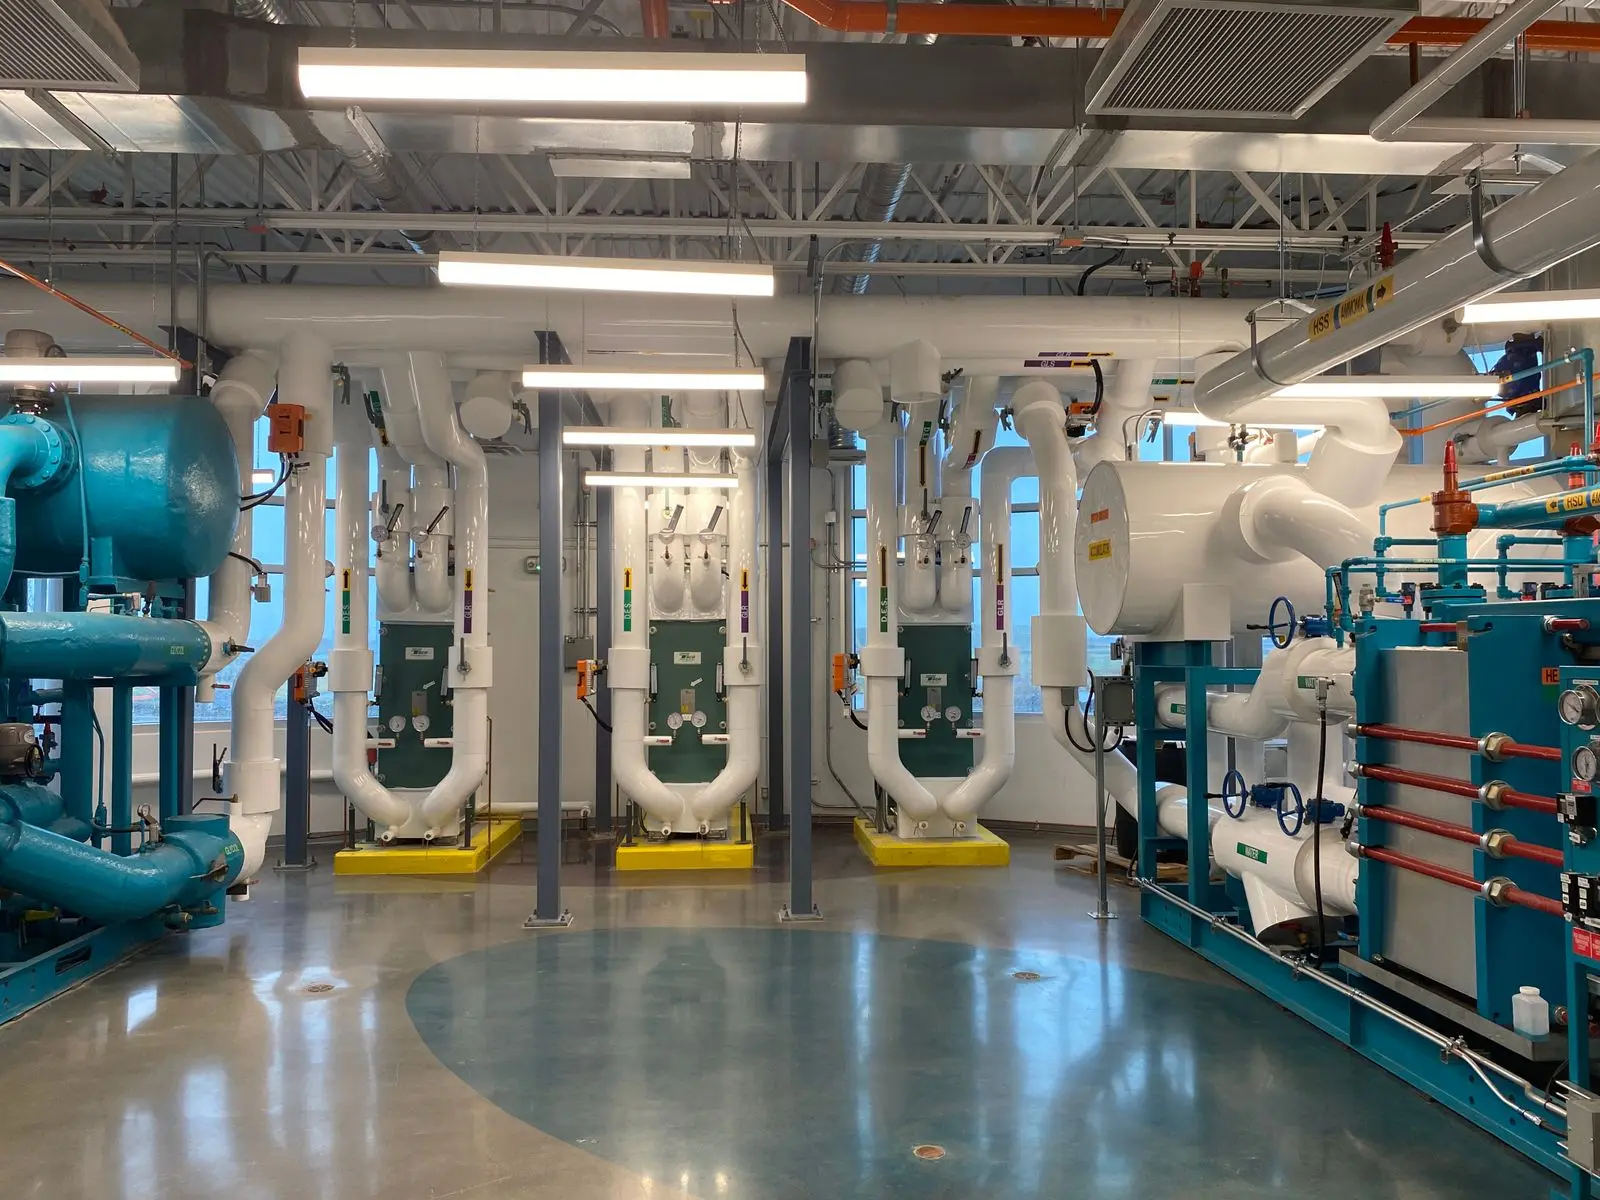
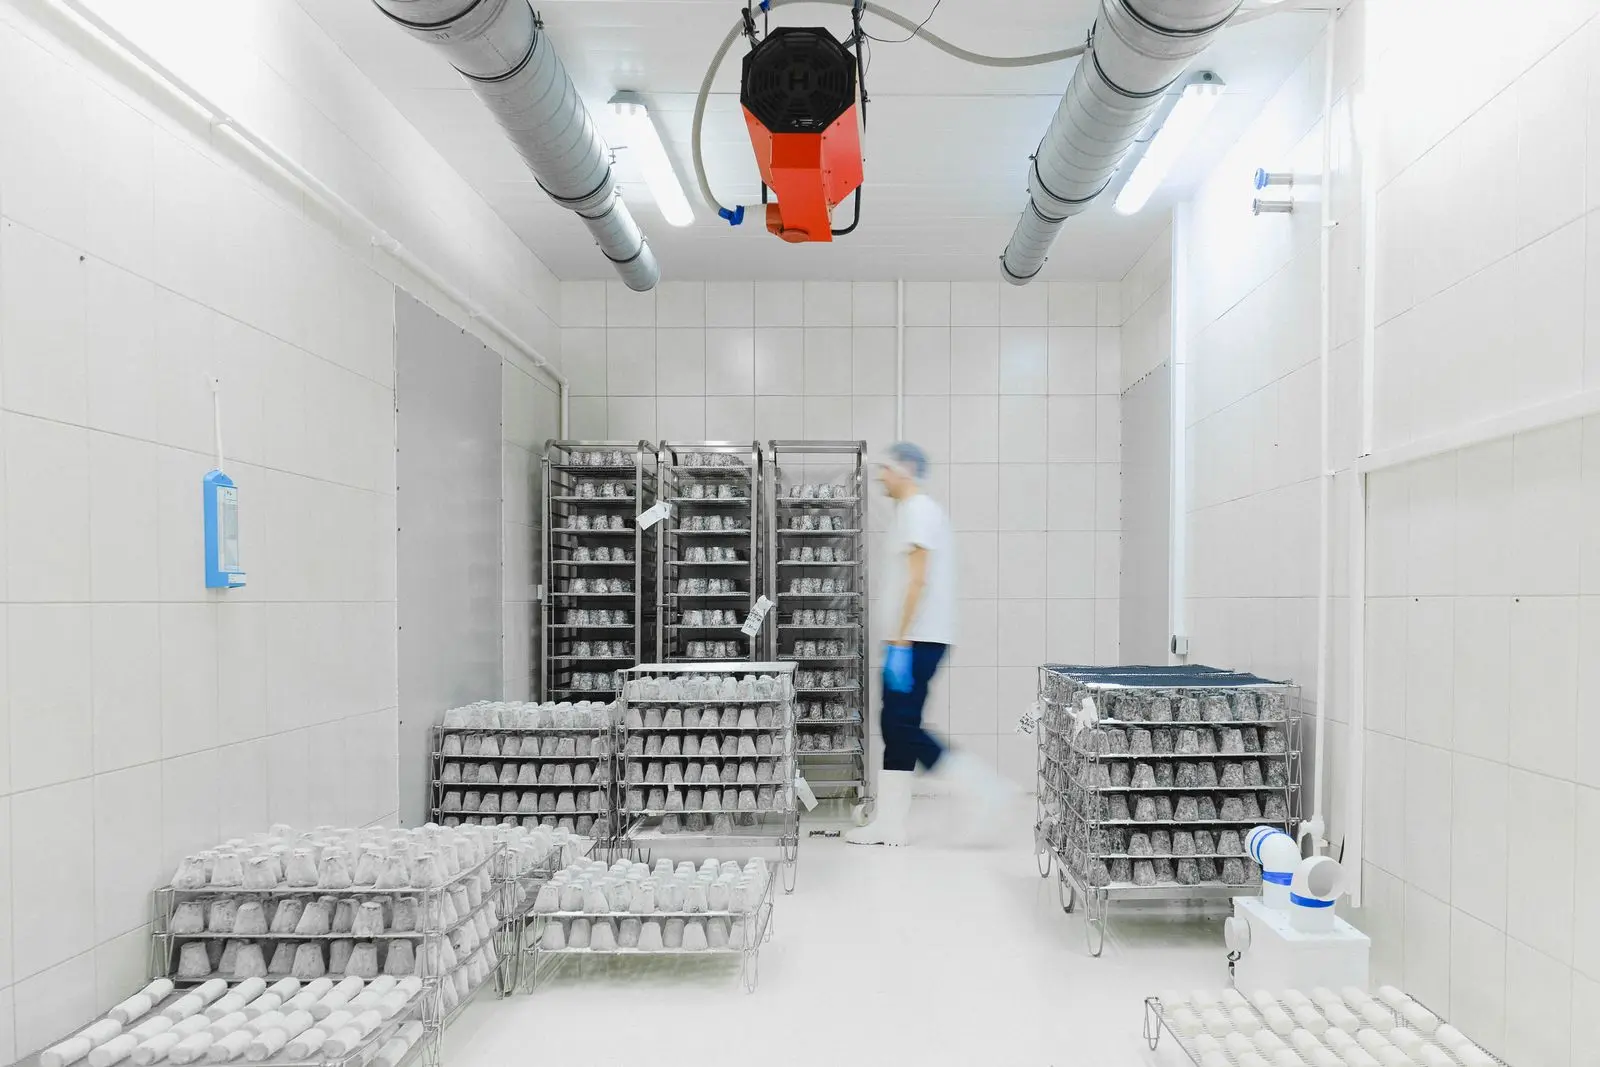
See how asset-level monitoring, controls and ongoing energy management have improved performance across multi-site facilities.
Review all case studies







Convenience retail
A four-site proof of concept used monitoring and low/no-cost actions before a broader multi-site rollout.
Grocery refrigeration
A before-and-after comparison evaluated refrigeration compressor consumption over matched two-week periods.
Food service
Monitoring exposed air-conditioning operation outside the store's required hours, leading to a targeted control response.
Why Seek Energy
Seek Energy is a Canadian company that combines proven Best.Energy technology with local scoping, implementation and ongoing energy-management support.
About Seek EnergyEvery meter, sensor and dashboard must support an operating or investment decision.
Priorities reflect the facility's loads, schedules, constraints and operating goals.
Prove the data, workflow and operational value at representative sites before scaling.
Define success and measurement before implementation, then keep performance visible.
Not sure where to start?
Answer ten practical questions about your energy spend, operating hours, major loads, current visibility and known issues.
Use the opportunity checkerStart with the right question
A focused assessment establishes fit, identifies the most useful data and defines a practical next step without committing to a full rollout.